Lab 2.4 - Setup the Kubernetes UI
Important
The following commands need to be run on the master only.
Note
You have two options to install the UI:
- Run the included script from the cloned git repo.
- Manually run each command.
Both options are included below.
“git” the demo files
Note
These files should be here by default, if NOT run the following commands.
git clone https://github.com/f5devcentral/f5-agility-labs-containers.git ~/agilitydocs

cd ~/agilitydocs/kubernetes
Run the following commands to configure the UI
Note
A script is included in the cloned git repo from the previous step. In the interest of time you can simply use the script.
cd /home/ubuntu/agilitydocs/kubernetes

./create-kube-dashboard
or run through the following steps:
kubectl create serviceaccount kubernetes-dashboard -n kube-system

kubectl create clusterrolebinding kubernetes-dashboard --clusterrole=cluster-admin --serviceaccount=kube-system:kubernetes-dashboard
Warning
These commands create a service account with full admin rights. In a typical deployment this would be overkill.
Create a file called kube-dashboard.yaml with the following content:
 1
 2
 3
 4
 5
 6
 7
 8
 9
10
11
12
13
14
15
16
17
18
19
20
21
22
23
24
25
26
27
28
29
30
31
32
33
34
35
36
37
38
39
40
41
42
43
44
45
46
47
48
49
50
51
52
53
54
55
56
57
58
59
60
61
62
63
64
65
66
67
# ------------------- Dashboard Deployment ------------------- #

kind: Deployment
apiVersion: apps/v1beta2
metadata:
  labels:
    k8s-app: kubernetes-dashboard
  name: kubernetes-dashboard
  namespace: kube-system
spec:
  replicas: 1
  revisionHistoryLimit: 10
  selector:
    matchLabels:
      k8s-app: kubernetes-dashboard
  template:
    metadata:
      labels:
        k8s-app: kubernetes-dashboard
    spec:
      containers:
      - name: kubernetes-dashboard
        image: k8s.gcr.io/kubernetes-dashboard-amd64:v1.10.0
        ports:
        - containerPort: 9090
          protocol: TCP
        args:
          # Uncomment the following line to manually specify Kubernetes API server Host
          # If not specified, Dashboard will attempt to auto discover the API server and connect
          # to it. Uncomment only if the default does not work.
          # - --apiserver-host=http://my-address:port
        volumeMounts:
          # Create on-disk volume to store exec logs
        - mountPath: /tmp
          name: tmp-volume
        livenessProbe:
          httpGet:
            path: /
            port: 9090
          initialDelaySeconds: 30
          timeoutSeconds: 30
      volumes:
      - name: tmp-volume
        emptyDir: {}
      serviceAccountName: kubernetes-dashboard
      # Comment the following tolerations if Dashboard must not be deployed on master
      tolerations:
      - key: node-role.kubernetes.io/master
        effect: NoSchedule

---
# ------------------- Dashboard Service ------------------- #

kind: Service
apiVersion: v1
metadata:
  labels:
    k8s-app: kubernetes-dashboard
  name: kubernetes-dashboard
  namespace: kube-system
spec:
  ports:
  - port: 80
    targetPort: 9090
  type: NodePort
  selector:
    k8s-app: kubernetes-dashboard
Apply Kubernetes manifest file:
kubectl apply -f kube-dashboard.yaml
To access the dashboard, you need to see which port it is listening on. You can find this information with the following command:
kubectl describe svc kubernetes-dashboard -n kube-system

Note
In our service we are assigned port “30156” (NodePort), you’ll be assigned a different port.
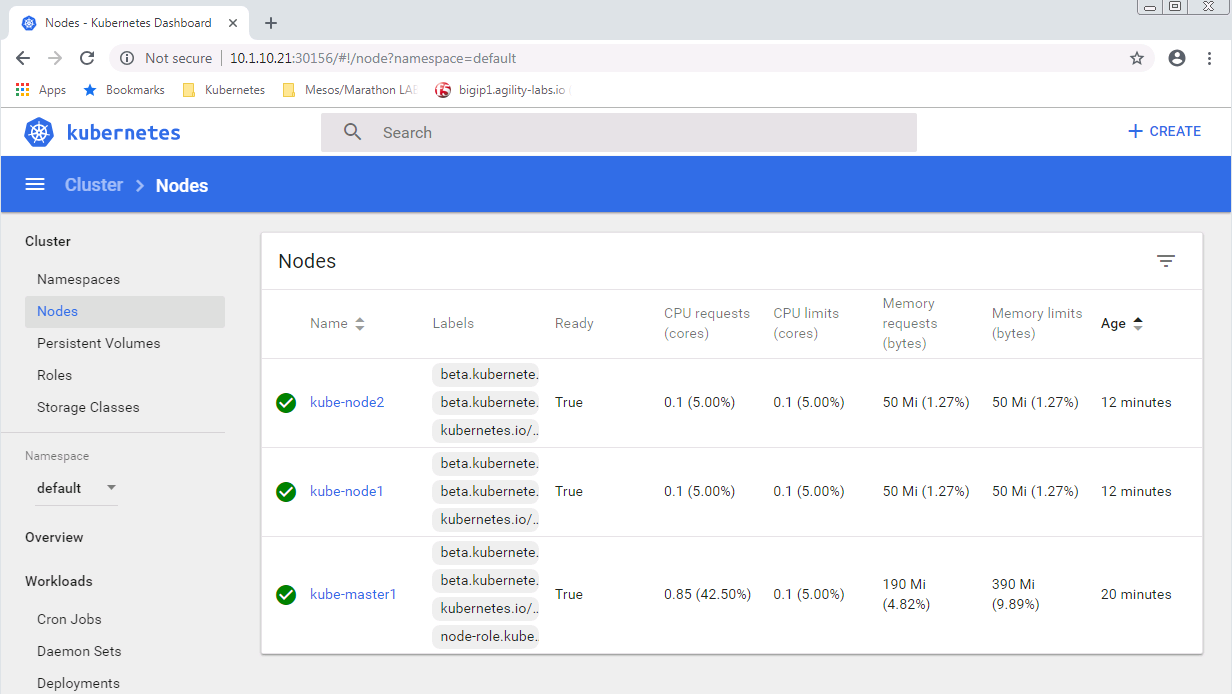
We can now access the dashboard by connecting to the following uri http://10.1.10.21:30156